Picture gallery | Insights into research
Superconducting Gravimeter Zugspitze | Section 1.2 Global Geomonitoring and Gravity Field
![[Translate to English:] Zugspitze, snow](/fileadmin/_processed_/c/4/csm_Supraleitgravimeter-Zugspitze_Christian-Voigt_1_2_Globales_Geomonitoring_und_Schwerefeld_9588ad3686.webp)
The superconducting gravimeter on the Zugspitze measures the temporal variations in gravitational acceleration continuously and with high precision. In a research project called G-MONARCH, gravimetric methods are being used to improve our understanding of the Alpine water balance using the Zugspitze as an example. G-MONARCH stands for "Gravity-MONitoring for Alpine Research Catchment Hydrology". By analyzing gravity, it is possible to make statements about the underlying masses and their changes.
The building on the Zugspitze, where our gravimeter is located, is the former high-altitude radiation measuring station of the Max Planck Institute for Extraterrestrial Physics and is a listed building. Built in 1963, the futuristic building is also known as the "tooth" or "submarine".
Tracking the Earth‘s mass movements | Section 1.2 Global Geomonitoring and Gravity Field
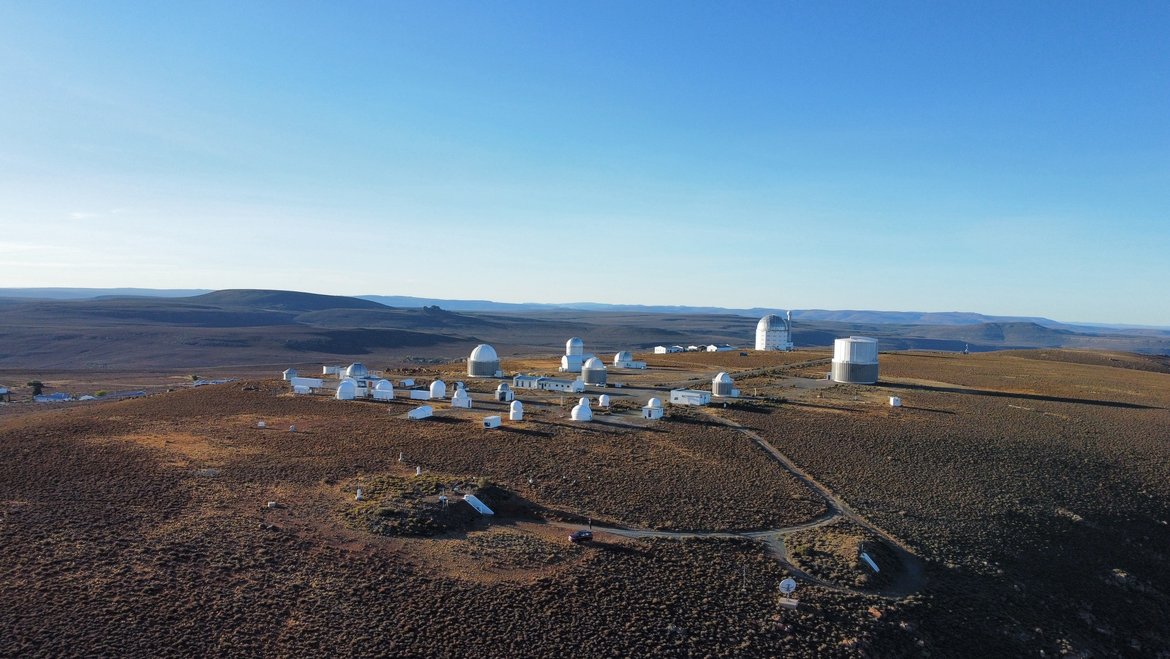
The picture shows the campus of the South African Astronomical Observatory about 350 km north-east of Cape Town. Here, near Sutherland, we have been operating the SAGOS geodynamic observatory with our South African partners since 1998. It includes instruments for measuring soil moisture and groundwater levels, pulses of the Earth‘s magnetic field and a reference station for geodetic satellite data.
Our superconducting gravimeter is very special. It enables extremely precise, long-term stable and continuous recording of temporal variations in the Earth‘s gravity field, which provides us with information about mass redistributions in the entire Earth system. With these long-term gravity measurements, we can detect the smallest geodynamic signals, for example 3rd degree ocean tides with amplitudes in the range of nGal (10-11 m/s²). They are part of the complex tidal pattern created by the influence of the moonʼs gravity on the Earth.
These highly sensitive measurements require extremely stable environmental conditions. Far away from human influence, the observatory is located at an altitude of 1755 m in a dark sky reserve in the Karoo semi-desert. In the middle of the large dolorite plateau, there is very little tectonic activity. Additional protection is provided by the thermally insulated underground bunker in which the measuring chamber is located. Incidentally, our superconducting gravimeter is moving this year to a new site: the Volcanic Eifel region of Germany.
Satellite Receiving Station Ny-Ålesund | Section 1.2 Global Gravity Field and Geomonitoring
![[Translate to English:] Ny Alesund satellite receiving station, arctic snowy landscape with two domes](/fileadmin/_processed_/b/2/csm_NyAlesund_Carsten-Falck-GFZ_4380d806bd.webp)
The picture shows the satellite receiving station in Ny-Ålesund on Spitsbergen. The two domes are two antennas. The hut in the middle houses the receiving equipment. The station receives data from research satellites in polar orbits. Ny-Ålesund is the northernmost place in the world that can be reached by regular means of transportation such as airplanes and ships.
The current most important task of the NYA station is the reception of the two GRACE Follow On satellites (in orbit since 2018). The GFZ is responsible for the complete reception of the satellite data, for which the NYA Station is used as the primary receiving station of the mission.
Keep smiling: Technical maintenance in the freezing cold | Section 1.2 Global Geomonitoring and Gravity Field
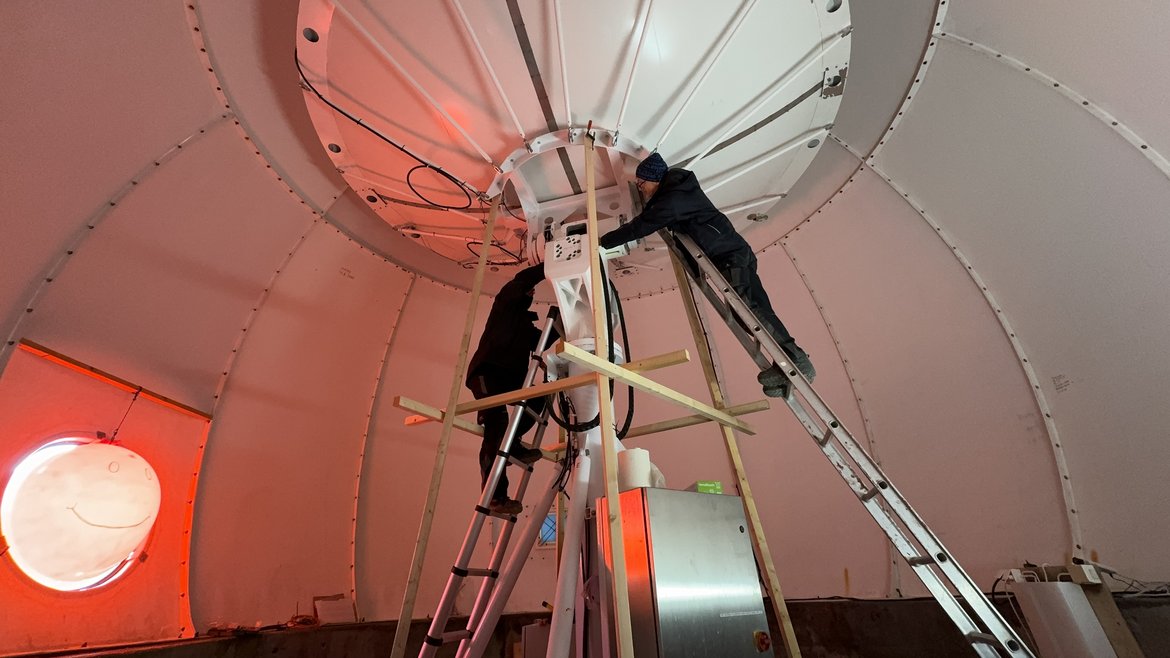
Here we are carrying out maintenance work on one of the two antennas at our satellite receiving station in Ny-Ålesund (Spitsbergen, Norway). The antenna is supported by a wooden frame, which makes our work easier. While we are constantly upgrading components such as computers and satellite receivers, the drive technology for the antennas is only overhauled when necessary. A lot depends on the drive working properly, as the antennas receive weekly “schedulesˮ from the GFZ. They then actively track satellites that pass over the receiving stations and send data back to Earth. After around 20 years of operation, with an average of 25 satellite contacts per day, there were clear signs of wear and tear. A talent for improvisation is needed to get the job done on site – especially in the icy cold of Spitsbergen: on this occasion, a large bouncy ball protected us from the cold. Without further ado, we used it as a “swing doorˮ to close the entrance, as the dome only has a simple outer lid that cannot be put on from the inside. With its warm smile, our new friend quickly became the talk of the small village, which has between 30
and 150 inhabitants, depending on the time of year.
Huge holes in the ground | Section 1.2 Global Geomonitoring and Gravity Field
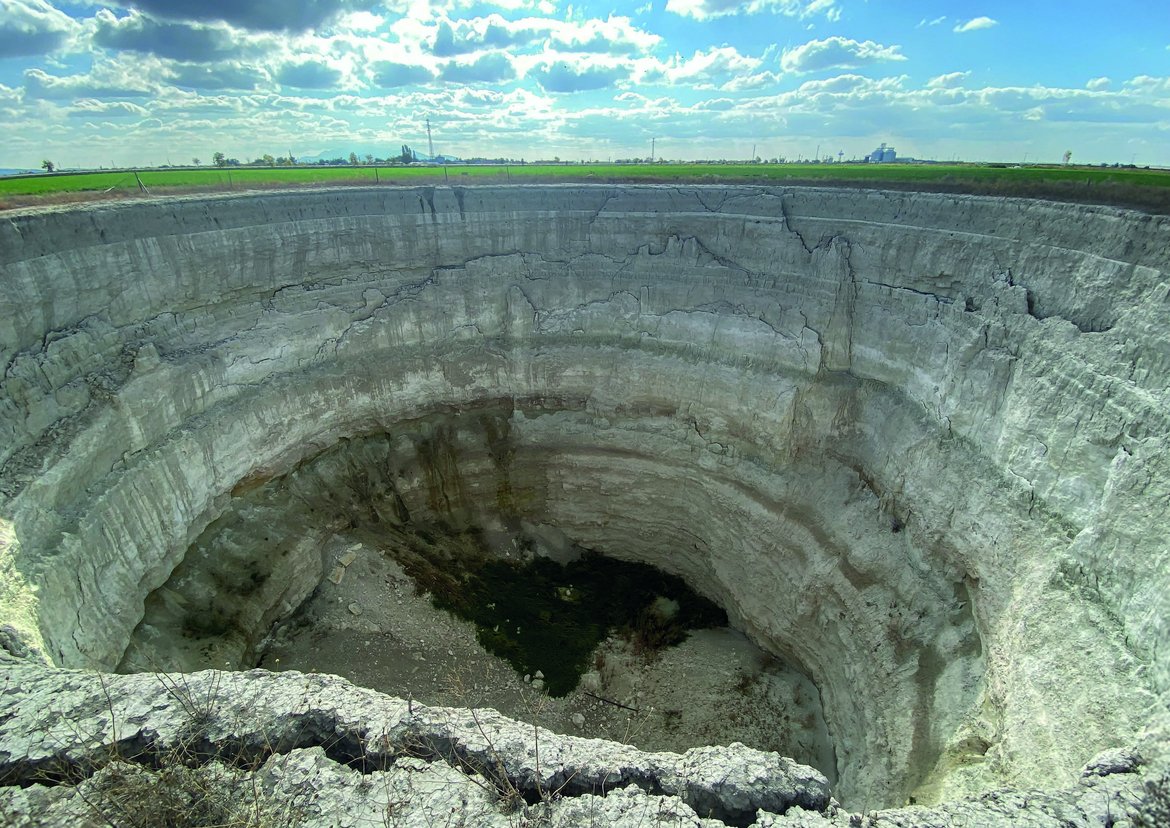
The Konya region in Türkiye is littered with often huge sinkholes: holes in the karst soil that occur naturally, but that are becoming more prevalent there due to intensive groundwater extraction for agricultural purposes. These sinkholes can reach a depth of 20 m and a width of 40 m. The problem is further exacerbated by reduced rainfall and long droughts – both consequences of climate change. There are currently over 2,500 sinkholes of varying sizes in the region.
We visited Konya as part of the SPACETIME project, in which Turkish and German researchers investigate the spatial-temporal dynamics of water and carbon storage on the mainland in relation to climate change, land use, land cover, and land management in Türkiye.
Data from our GRACE and GRACE-FO satellite missions reveal large-scale changes in the water cycle in eastern Türkiye. Additional techniques, such as measurements from Global Navigation Satellite Systems (GNSS) and remote sensing, can be used to monitor areas at risk on a smaller scale.
Corals as sea level indicators | Section 1.3 Earth System Modelling

Coral microatolls are excellent indicators of relative sea level and provide information about past sea level changes. Coral colonies grow and survive near the base of the intertidal zone. In St. John's Island and Lazarus Island off the coast of Singapore exists a field of living and fossil microatolls. Ideally, the corals have multiple concentric rings on their upper surfaces, with each ring formed after a partial coral die off due to a prolonged exposure at extreme low water. The determination of the age and height of the rings enables the reconstruction of Singapore's relative sea level since the 20th century and during the mid-Holocene.
These sea level indicators are used to validate our Earth system models such as coupled climate models or solid Earth deformation models and the associated modelled relative sea level change since the last deglaciation. The picture was taken on a field trip in connection to the World Climate Research Program (WCRP) Sea Level Conference and the PALSEA Annual Meeting (Paleo Sea Level and Ice Sheets for Earth's Future).
Zarnekow polder at the TERENO Northeast observatories | Section 1.4 Remote Sensing and Geoinformatics
![[Translate to English:] Luftaufnahme, Flussdelta](/fileadmin/_processed_/a/6/csm_11164_Zoellner_Juli_a1aa092a65.webp)
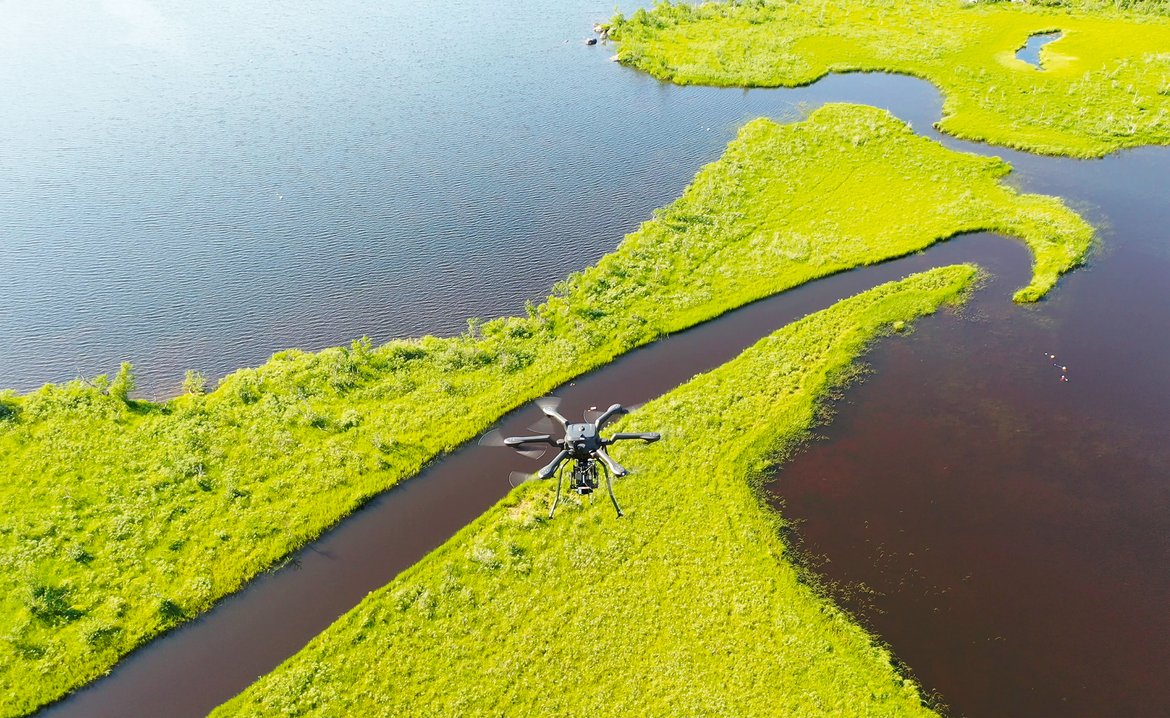
The aerial view shows the Zarnekow polder at the TERENO Northeast observatories near Dargun, Mecklenburg-Vorpommern, which almost completely dried out during the extreme summer of 2018. The photograph was taken while flying over the area for the purpose of analysing the exchange of water and greenhouse gases between earth and atmosphere. The former percolation mire was artificially drained for the first time more than 200 years ago.
In the 1960s, the fen was completely drained and converted to grassland. In 2004, the now protected landscape was re-wetted. Since fens represent important natural carbon reservoirs capable of retaining large amounts of greenhouse gas, their reclamation can also be seen as a long-term contribution to climate protection. Due to the great heat and drought during the summer of 2018, the polder, which is also an important biotope for waterfowl, fell dry for several months – the underlying cause being climate change. The consequences for the further development of the fen and the associated ecosystem remain unknown.
Understanding the cycles between ocean, ice and atmosphere | Section 1.4 Remote Sensing and Geoinformatics

84.402443°N / 14.675241°E, April 10th 2020, shortly before one o'clock in the morning: During the MOSAiC expedition in the Arctic Ocean I was on polar bear watch duty at our camp. On this evening we were keen to get out and see something other than the Polarstern, our research vessel. We also felt like trying out how it feels to sleep outside at minus 30°C, drifting on an ice floe across the Arctic Ocean. After the last meeting that evening, we trekked a few kilometers across the pack ice, equipped with thermal mats, tents, sleeping bags and hot drinks.
We choose a spot behind a pressed ice ridge, out of sight and, above all, away from the noise of the Polarstern whose auxiliary diesel had to provide heat and electricity for man and machine around the clock. Initially grey and lacking in contrast due to cloud cover, this changed around midnight when the prevailing sun, which was far to the north, transformed the ice landscape into an endless expanse of white, various shades of blue and slightly pink glowing ice sculptures. It was only the cold that drove you into your sleeping bag at some point, where it seemed like a "normal" night in a tent. A bit fresh maybe, next time the thermal mat should be a little more than two centimeters thick.
In our GFZ subproject of the international MOSAiC expedition we are dealing with the biogeochemical cycles between ocean, ice and atmosphere. In particular, we are looking at carbon and heat fluxes as well as at methane isotope fractionation during thawing and freezing processes. Our findings contribute to a better understanding of processes in climate projections and provide information on how climate change affects sensitive elements of the Earth's surface system.
Tracking greenhouse gases with six propellers | Section 1.4 Remote Sensing and Geoinformatics
Moors and tundras north of the Arctic Circle are crucial ecosystems in the global carbon cycle. Due to climate change, permafrost soils are increasingly thawing in this environment – with enormous implications for the release of greenhouse gases. We are conducting research here in Abisko-Stordalen, Sweden, home to a station belonging to the European ICOS greenhouse gas monitoring network.
As part of the IM4CA (Investigating Methane for Climate Action) project, we are investigating how changes in vegetation and soil moisture affect methane and CO₂ emissions. Our hexacopter is a valuable tool for this: thanks to its high load capacity, long flight time, great stability and precise flight control, we can safely and repeatedly survey large areas under real field conditions.
Here, the hexacopter is carrying a 6-kilogram hyperspectral sensor that records the sunlight reflected from the ground. By analysing the colour spectrum, we learn about the type of vegetation, its biochemical state and water content. In combination with ground-level measurements of methane and CO₂ emissions, models can be trained to interpret the spectral ‘colour’ of the vegetation, providing valuable information on its activity and the processes that release or bind greenhouse gases.
Detecting gases with the blessing of Herðubreið | Section 1.4 Remote Sensing and Geoinformatics
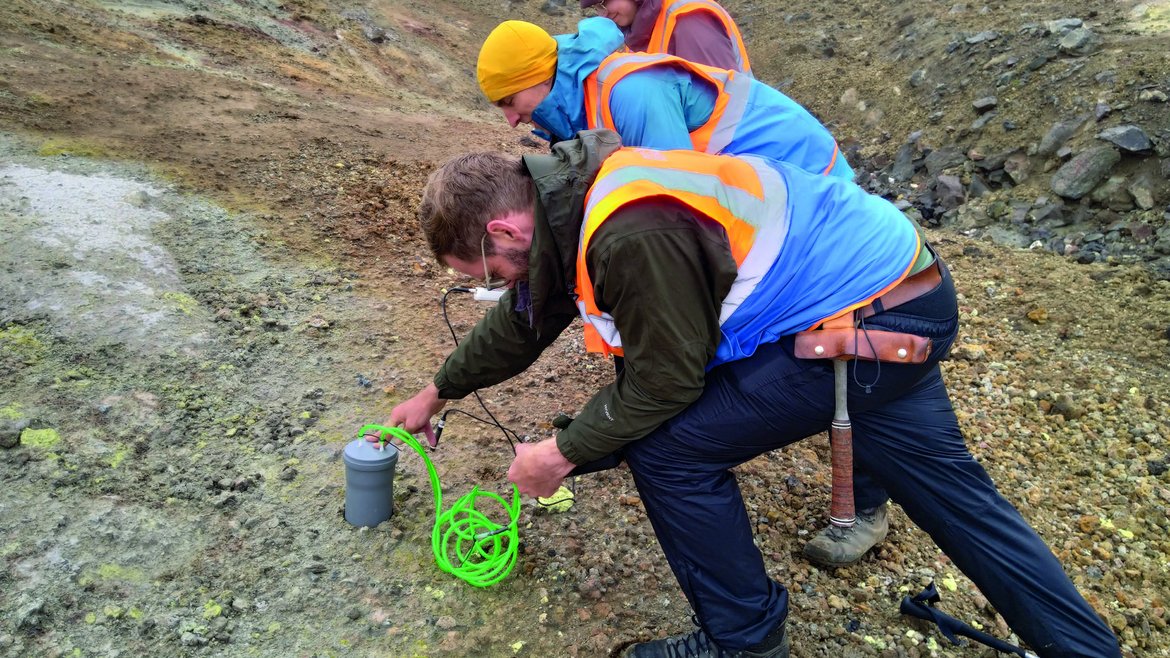
The caldera of the active Askja volcano is one of Iceland's most scientifically interesting places. This caldera is constantly changing: land rises, the slopes subside and the permafrost in the ground thaws; Askja is also known for its geothermal energy. We come here regularly to do field work. We are currently taking temperature and multi-gas flow measurements to search for gases such as carbon dioxide and hydrogen sulphide. These gases indicate changes in the magmatic and hydrothermal systems, which can also point to dangerous precursor events for volcanic eruptions. With our ground-based gas measurements, we evaluate degassing areas that we have detected through image analysis in drone data.
Incidentally, we were particularly lucky this year.
We were able to count on the support of Herðubreið, the highest mountain in this area: On the day we arrived in Askja, the wind was so strong that we could not even pitch our tents; they would simply have been blown away. The rangers advised us to ask Herðubreið for good weather, in accordance with local belief. We actually did that, and lo and behold, we had perfect weather during the following days — the best I have experienced there in recent years.
Monitoring a rewetted bog in Brandenburg | Section 1.4 Remote Sensing and Geoinformatics

This thermal image shows the long-wave thermal radiation of a moorland landscape, which is invisible to the human eye. The colours represent the varying temperatures – from the warm red of 20 °C for the sour grasses and trees that are still inactive, to the cool blue of 13 °C for the water areas. This tells us about the growth and vitality of the plants: on a sunny winter's day, dry, inactive plants heat up particularly strongly. This changes in the productive phase when water evaporates through the stomata of the leaves. The more biomass is produced, the greater the visible cooling effects in summer.
The amount of biomass that is built up is in turn an indicator of the availability of water, but also of the amount of CO2 stored in the landscape. Using drones and thermal cameras, we are able to gain valuable insight into how the Butzener Bagen, a moor in the Lieberoser Endmoräne, is developing. It has been actively rewetted so that it can potentially transform from a CO2 source into a CO2 sink, thereby contributing to climate protection.
The investigations are part of our LauMon project, in which we are developing a remote sensing-based, AI-controlled monitoring system for Lusatia. From the condition of nature reserves and the mapping of plant species to yield forecasts in agroforestry systems, an agricultural information system is being set up in collaboration with local companies to positively shape structural change in the Lusatia region.
Repair of the measuring station at the active Láscar volcano | Section 2.1 Physics of Earthquakes and Volcanoes

The Láscar volcano, which is about 5,600 m high, is considered the most active volcano in northern Chile. On this day we only had to cover 700 meters to the summit; however, due to the low air pressure the ascent proved extremely strenuous. Apart from that, we also had heavy measuring equipment with us. Even our porters barely managed the ascent so that we scientists had to also take the backpacks and equipment carried by them which meant walking the way multiple times. Once we reached the top we were, however, rewarded by the magnificent scenery of the neighbouring volcanoes of the arid Andes Mountains with a view into the 800 m deep crater of the Láscar volcano at the same time.
Láscar is a stratovolcano formed by two volcanic structures that have grown together. Its activity is regularly determined by hydromagmatically-triggered steam explosions. It can also emit powerful lava flows and large amounts of ash. A particularly large eruption in 1993 even led to showers of ash on the city of Buenos Aires, 1,500 km away. Due to a smaller eruption that occurred at the Láscar volcano at the end of last year we originally wanted to check the functionality of our measuring station. However, lightning then struck in January – not a rarity due to the exposed location. The power supply, data logger and carbon dioxide sensors had thus to be replaced so that monitoring could continue without interruption. The measured data are transmitted directly to the GFZ in Potsdam via satellite.
The volcano is also monitored with cameras and via satellites. And, furthermore, the GFZ GFZ Helmholtz Centre for Geosciences in cooperation with its Chilean partners, conducts seismic campaigns and experiments, maps and measures the volcano's geomorphology with drone flights and performs thermal analyses. All of this takes place within the framework of the Integrated Plate Boundary Observatory Chile | IPOC.
Volcano eruption of the Cumbre Vieja | Section 2.1 Physics of Earthquakes and Volcanoes

Not often do you get to see scenes like this, even as a volcanologist. Together with colleagues from Spain, our team from the GFZ was standing barely half a kilometre from the crater rim on La Palma when the freshly deposited volcanic ash, lapilli and bombs – the glowing pile in the right half of the image – started moving again and plunged back into the crater. The rain of fire impressively demonstrates the importance of maintaining the 400 metres safety distance. The picture was taken in November 2021 at Cumbre Vieja, which had been erupting to over 3 km in height for two months.
It was already our third trip there. Only days after the eruption began on 19 September of the same year, the GFZ had sent a task force to La Palma to provide a rapid assessment of volcanic eruptions and earthquakes on the island. Together with Spanish institutions, we began to investigate the interaction of the eruption with the quakes and surface deformations. For this purpose, we used seismometers, inclinometers, thermal cameras and drones, as well as images from radar satellites. It was particularly important to record the direction and changes of the lava flows, as they ran through populated territory.
New Land: Still Unstable | Section 2.1 Physics of Earthquakes and Volcanoes

The glowing lava front, flowing into the Atlantic Ocean after the eruption of the Tajogaite volcano on Cumbre Vieja (La Palma, Canary Islands), reaches a temperature of over 1,100 °C. The plumes of steam are rich in hydrochloric acid and fine volcanic glass, among other substances. This scene illustrates the destructive but also the constructive forces that shape oceanic islands: lava flows erode land but they also create new land. The newly formed lava delta is of great scientific interest.
Our research focuses on the deformation of the growing volcanic edifice to better understand how new coastal terrain is formed. Scarcity of new land on islands raises the question of how it should be used. Our geodetic and remote sensing data show that, five years after the eruption, the lava delta is still cooling, compacting, deforming and subsiding. This underscores that although volcanoes are the driving force behind land formation, the resulting terrain remains geologically unstable for years, or even decades.
ROTTnROCK – What makes volcanoes rot from the inside? | Section 2.1 Physics of Earthquakes and Volcanoes

Around 20 million cubic metres of ash fell on the Canary Island of La Palma during the volcanic eruption in 2021. However, this was probably not the cause of the death of these pine trees. Instead, they are evidence of how toxic the volcanic degassing is, particularly due to sulphur dioxide. The dead trunks are located just 250 metres east of one of the 18 craters and help us to track down degassing sites underground.
As part of my EU-funded ERC grant project ‘ROTTnROCK’, we are investigating the effects of such gases and hot, acidic fluids on the stability of craters and volcanic rock. Our observations show that they corrode rocks so that the volcanoes can literally rot from the inside out. We suspect that this is a major cause of unexpected volcanic eruptions and collapses of crater flanks.
We therefore want to understand the process of this so-called alteration in detail, monitor it with innovative drones and satellite sensors, simulate and analyse it in the laboratory and then incorporate these findings into numerical prediction models.
Northern Lights over Lake Ebingen | Section 2.3 Geomagnetism
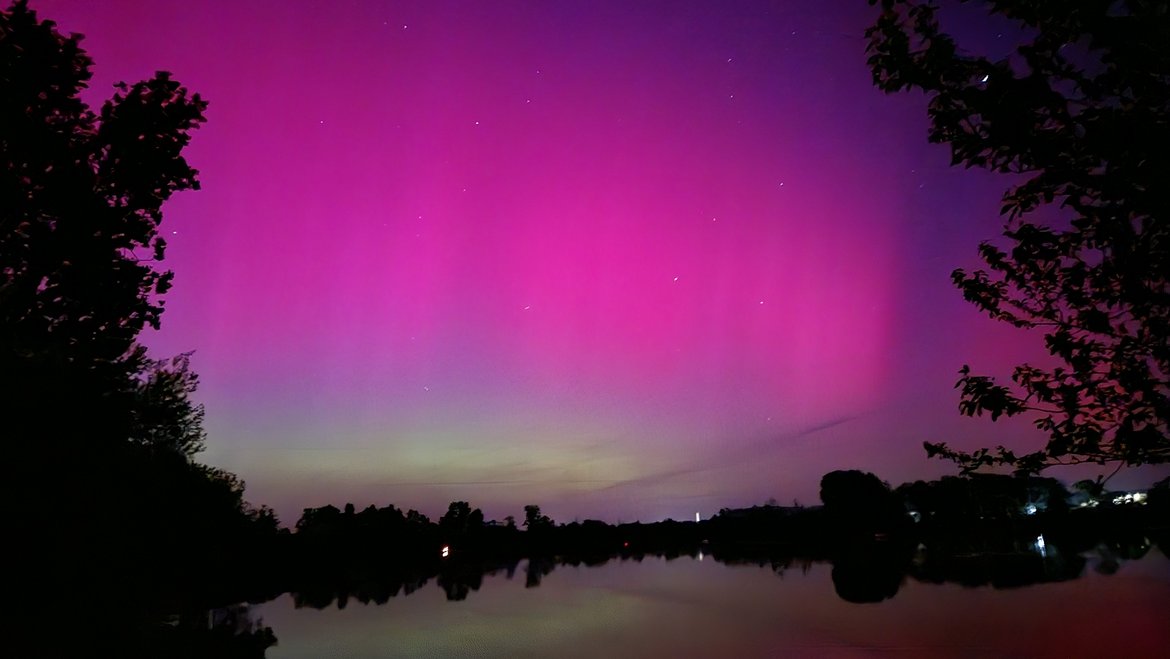
A lucky coincidence brought us this photo. The camera makes the auroras appear even more intense. This rare natural phenomenon is closely linked to our research in the “Geomagnetismˮ and “Space Physics and Space Weatherˮ sections.
Auroras occur when particles of the solar wind collide with atoms and molecules in the atmosphere and excite them to glow. They normally occur in ovals of around 3,000 to 4,000 km in diameter around the poles. In Europe, this is the case in northern Scandinavia. Only rarely – during very strong solar activity – do they reach lower latitudes, as here near Bamberg on 10 May 2024 at 11 p.m. This is because the Earth‘s magnetic field generated in its core forms a very effective protective shield around the Earth: the magnetosphere. As beautiful as the glow is, the charged particles and electromagnetic fields of the solar wind can also have destructive effects on our high-tech, satellite-dependent society. Satellites can be damaged, GPS systems can fail. Even our power grids can be affected if we are hit by a particularly strong geomagnetic storm. A precise understanding of the magnetosphere and basic research for more reliable space weather forecasts are therefore essential.
Electromagnetic Particles above the South Atlantic | Section 2.3 Geomagnetism
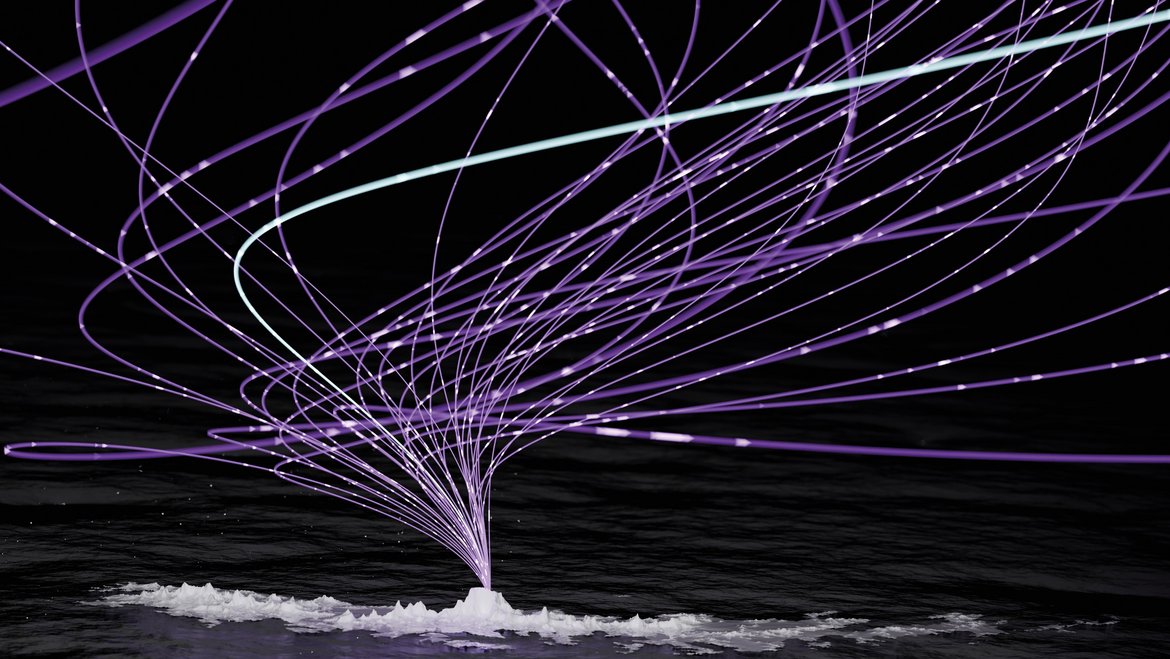
The image shows the trajectories of charged particles in the Earth's magnetic field above South Georgia Island (Spanish: Isla San Pedro) in the South Atlantic. The brightly coloured beam is based on currently measured data, while the purple lines show equally probable trajectories that we have modeled for a point in time 8,000 years ago.
The particles flowing in from space produce isotopes that we can detect in ice cores, sediments and rocks, and that help us to assess processes such as weathering, climate change and the development of the Earth magnetic field. Taking into account the uncertainties in their trajectories helps to assess which models of these processes are consistent with the data.
Uncertainties arise from various sources: inaccuracies in our assumptions about the (past) world, in our models, or in the data. The figure is a good example of this. South Georgia is located in mid-latitudes (54° 19' south), where a complex interaction between data availability and process complexity leads to particularly high uncertainties.
The seismic traces of wild animals | Sections 2.4 Seismology and 2.6 Earthquake Hazard and Dynamic Risks
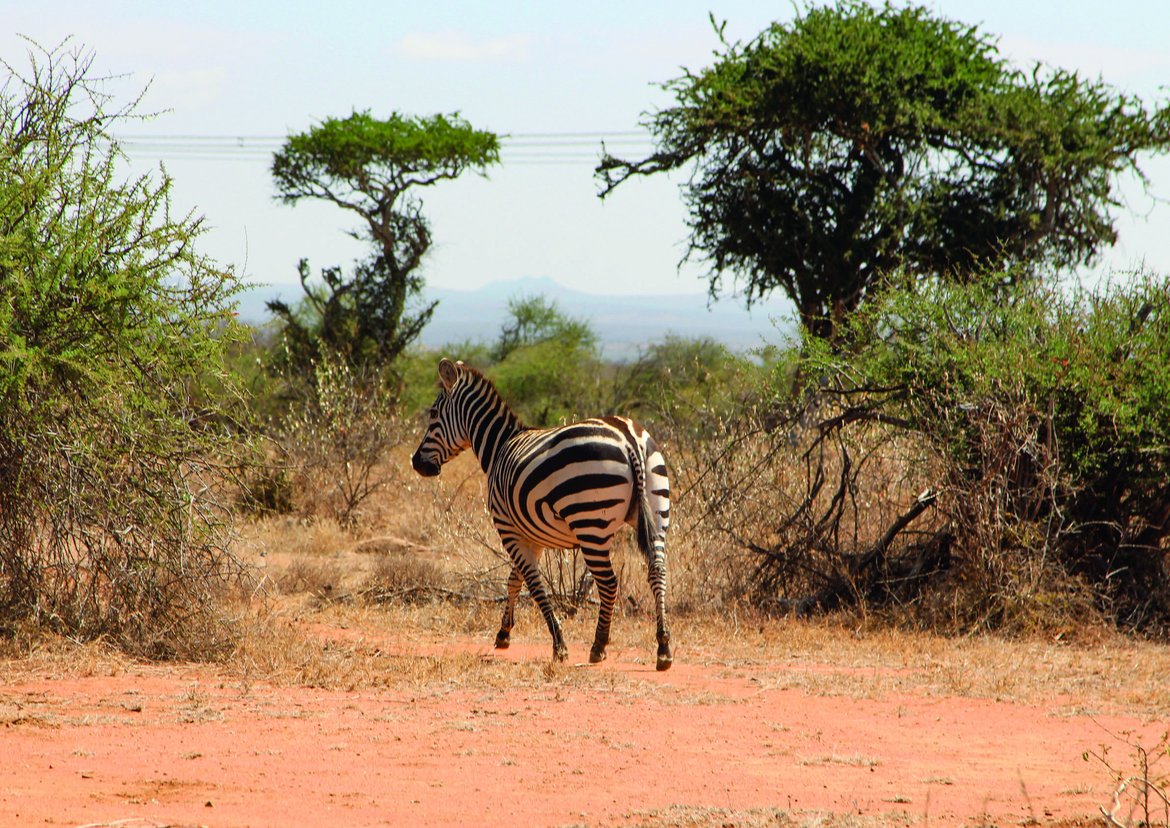
Plain zebras, hyenas, elephants and giraffes are rather unusual objects of observation in the geosciences. But even they leave characteristic patterns in seismic data with their species-typical gait – sometimes over hundreds of metres. As part of my Discovery Fellowship project “SeismicLife”, I am investigating how we can use the footprint signals of large mammals – in combination with AI – to develop new methods of animal observation that complement the findings from camera traps and acoustic sensors.
Last year, I spent three months in Kenya at the Mpala Research Centre near Mount Kenya. We installed our seismic sensors at a waterhole. The sensors have to be buried deep enough to prevent curious animals from playing with them. Three Kenyan students and rangers assisted us with our fieldwork and with on-site data analysis and also helped us to stay safe when we encountered wild animals.
In the mornings, we spent two hours observing the animals. We plan to later compare our notes with the seismic data. On one occasion, we counted more than 50 elephants. They arrived in small groups and greeted each other warmly. Those were truly magical moments.
Bathymetry measurements Laacher See | Section 2.5 Geodynamic Modelling

What looks like a relaxed fishing trip is actually our field campaign on Lake Laach in the Eifel — the most active volcanic lake in Germany. Volcanic gases are continuously rising from the bottom of the lake and we analyse the gases at regular intervals for their composition and concentration in order to detect changes in the activity of the magma system and to better assess the hazards they may pose.
You can see my colleague, Walter Düsing, lowering a CTD measuring device into the water, which records conductivity and temperature as a function of depth. We use a depth sonar (red sphere) to localise the gas emission points on the lake floor, which can be as deep as 51 metres. We can then steer our underwater drone there to collect gas bubbles, which we analyse in the laboratory. This allows us to find out whether the gas comes e.g., from a magma chamber or the Earth's crust. The yellow box contains a CO2 analyser that we use to determine the diffuse CO2 flux at the lake surface.
Lake Laach is part of the Observatory for Central European Volcanic Provinces, which is operated by the GFZ. Our research is also part of the EU-funded ERC grant project EMERGE which is focusing on the quantification of CO2 emissions in tectonically active areas.
Twenty thousand leagues under the lithosphere | 2.5 Geodynamic Modeling

The Earthʼs interior is a surprisingly dynamic and complex system. In the model shown here, which depicts the inner Earth 865 million years ago, we see, for example, interactions between subducting oceanic plates (in blue) and deep structures of the Earthʼs lower mantle. These interactions give rise to mantle plumes (in red) that transport warm rock material from a depth of 2,900 km to the surface.
Our project MEET (Monitoring Earth Evolution Through Time), an ERC Synergy Grant led by Stephan Sobolev at GFZ, investigates how the coupling of surface and deep processes influences plate interactions and thus contributes to the evolution of current
plate tectonics over hundreds of millions of years. To this end, we have developed a digital twin of the Earth, i.e. a virtual image that we can use to analyse “what-ifˮ scenarios.
The image represents a milestone in our research. We have created a global geodynamic model using the ASPECT community code, which dozens of researchers have been working on for years. We derived the movements of the plates from palaeomagnetic plate reconstructions. For me personally, this model is a decisive step in my understanding of the Earthʼs geological history.
Fibre optics into the heart of a fault | Section 2.6 Earthquake Hazard and Dynamic Risks
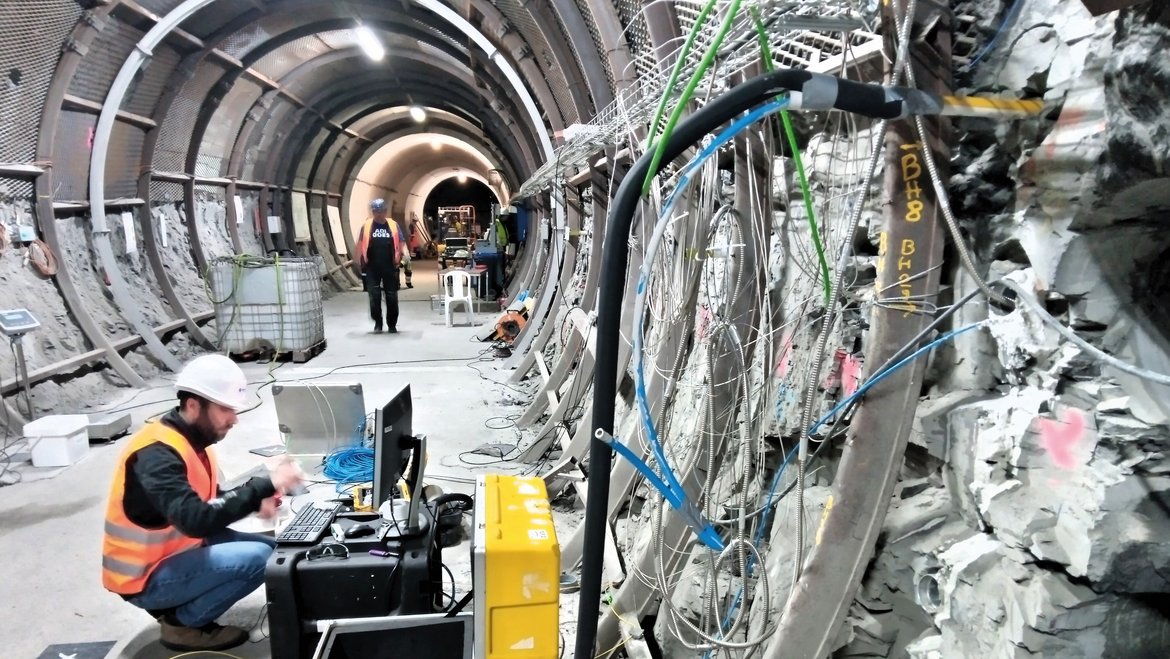
Built in the 1880s with pickaxes and shovels for the railway, the approximately 2 km long Tournemire Tunnel is now a high-tech underground laboratory. Located in France, on the southern edge of the Massif Central, it gives us access to a number of well-known faults and fracture zones.
We are interested in how and under what conditions a fault moves. This is not only essential for earthquake research, but also in the context of energy technologies that utilise the geological subsurface, such as geothermal energy or the storage of hydrogen and CO2.
With the 30-metre-long BH8 borehole, we reach the core of a fault from the tunnel wall at the top right of the image. We pumped water into the fracture zone and measured the deformation of the surrounding area with high precision over time. As a sensor, a hair-thin glass fibre was used, which we attached to a flexible plastic tube and pushed into the borehole. Light transported and reflected within this fibre changes when stressed by mechanical or thermal influences from the surrounding rock and we analyse these variations. The results of such controlled underground tests complement our laboratory experiments in order to understand the fracture process in rock across scales.
Critical raw materials from hot springs | Section 3.1 Inorganic und Isotope Geochemistry

The picture was taken in the Mbeya region in southern Tanzania. Here we are investigating whether indispensable but rare raw materials, so-called "Critical Raw Materials" (CRM), can also be extracted from hot water for geothermal application. The GFZ coordinates the large EU project "CRM-geothermal" with institutions from 14 EU states and six partner countries. One of them is Kenya, and we plan to include further countries in East Africa.
While working on this crack, which is part of the East African Rift Valley, we could hear the thermal water boiling in the fissures. With the hot springs and the lime stone travertine precipitated from them, it was one of the most interesting study sites of our expedition to Tanzania.
What many do not know: East Africa is a veritable hotspot for geothermal energy. Kenya has been one of the pioneers in its use since the early 1980s. And in Tanzania, hot water is extracted via boreholes and used for agricultural purposes in a pilot plant. Our aim is to find out in what concentrations the critical raw materials occur, and how they can be extracted in an environmentally friendly and socially acceptable way.
Across the ice field in seven weeks | Section 3.2 Organic and Earth Surface Geochemistry
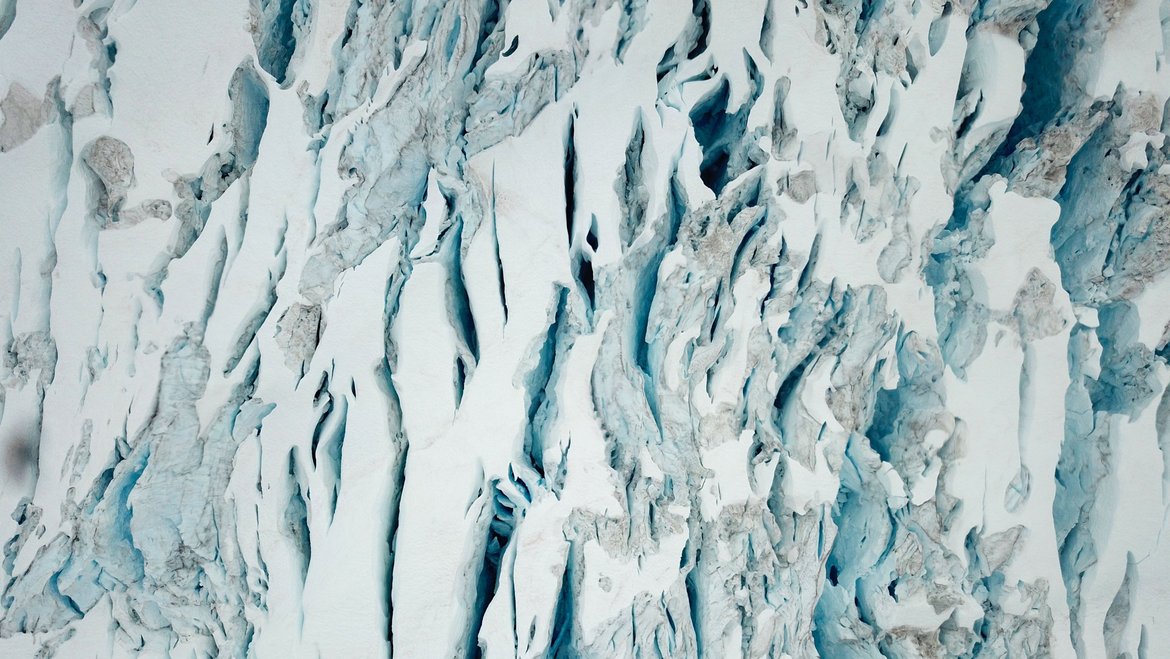
Glaciers flow like rivers, only much slower. And just as there are waterfalls, there are also icefalls. From time to time, blocks of ice break off with a thunderous roar. This picture, taken using a drone, shows huge crevasses up to 50 m long and up to 5 m wide in the Vaughan Lewis Icefall in the Juneau Icefield between Alaska (USA) and British Columbia (Canada). The aim of our remote sensing project was to create a 3D model of the icefall in order to identify where the flow rate of the ice is increasing or decreasing based on the structure of the crevasses. The seven-week crossing of the ice field was my first field work for my doctoral thesis. Normally, I only work on the computer. It is particularly difficult to model ice velocities accurately. On the ice, it was highly interesting to see how the individual glaciers differ, even when they are close together. The differences are due to the complex processes and the nature of the environment. This cannot always be fully represented in the model. The field trip experience is of great advantage when interpreting the results of my models. Quite hard to believe, but in this barren landscape, hummingbirds fly by from time to time. I saw some myself on the Taku Glacier.
Weathering processes on volcanic tropical islands | Section 3.3 Earth Surface Geochemistry

Spread over many shoulders, we carry our equipment along the crater wall down to Lac Flammarion on Guadeloupe. Our PALAVAS project is part of a French-German cooperation programme. We have everything we need to build a small floating platform, which we will use to drill into the lake bed and lift an 8 meter long sediment core. Why all this effort? To gain a better understanding of the intensive weathering and erosion processes on volcanic islands. This is important because rock weathering over geological time is one of the largest sinks for atmospheric CO2.
The drill core provides us with valuable information on the deposition of the radioactive beryllium isotope (10Be), which is carried into the lake by precipitation. This isotope makes it possible to determine the strength and speed of weathering. Rocks of magmatic origin in particular, such as basalt or gabbro, are likely to contribute significantly to CO2 withdrawal, as they dissolve comparatively quickly when exposed to rainwater. This is why tropical volcanic islands are so interesting for research. The active Souffrière volcano is only a few hundred meters away from this ancient caldera.
Violet ice algae on the Greenland ice sheet | Section 3.5 Interface Geochemistry

We recovered this ice core in July 2020 during our summer field expedition in South Greenland. Here we are about 75 kilometers west of Narsarsuaq. At the beginning of the expedition our camp was still on snow. Then we experienced three weeks of rapid snowmelt, persistent rain and strong winds of up to 80 kilometers per hour. Soon all the snow had disappeared. All that remained was the bare ice, which is populated by purple ice algae.
The black color on the top of our drill core is a mixture of minerals and various microorganisms. The dark discoloration is mainly due to the chromophoric purpurogalline pigment that ice algae develop to protect themselves from the high UV radiation. Our project "DEEP PURPLE" deals with all processes that darken the Greenland ice sheet: the physical, the microbial and their complex interaction. The project is financed by the Synergy Grant of the European Research Council. Its significance goes far beyond Europe. When ice and snow darken, they absorb more sunlight and, with this, heat. This accelerates the melting process which, in turn, leads to a rise in sea level.
This very first drill core of the season and many others that followed helped us first to optimize the method of preserving snow and ice and its microbial colonization. All cores eventually drilled in the Greenland ice sheet, usually about one meter long, arrived safely at the GFZ after a long transatlantic boat trip in an industrial freezing container and are now being analysed in detail.
Geo-Paradise Iceland: From cooled lava to ice algae | 3.5 Interface Geochemistry

Iceland is paradise for us geologists. Although I am researching a completely different topic myself, these basalt columns make my “geological heartˮ beat faster. They are formed when lava cools and contracts rapidly. What is particularly fascinating is that
a regular structure of hexagonal columns forms in a completely natural way. Their analysis provides important information about volcanic processes, the behaviour of lava during volcanic eruptions and the composition of the Earth‘s crust. I took the photo on the way back from our field work at the Snæfellsjökull Glacier, on the Snæfellsnes peninsula in western Iceland. There, we collected samples of red and purple snow and ice algae. They darken the ice, accelerating glacier melting along with climate change. This is because dark ice reflects less sunlight and heats up more quickly. We are particularly interested in the conditions under which the algae multiply and how this affects the glacier in detail. As a technician in the team, I am responsible for preparing the samples, among other things.
Two beams for fascinating details on an atomic scale | Section 3.5 Interface Geochemistry
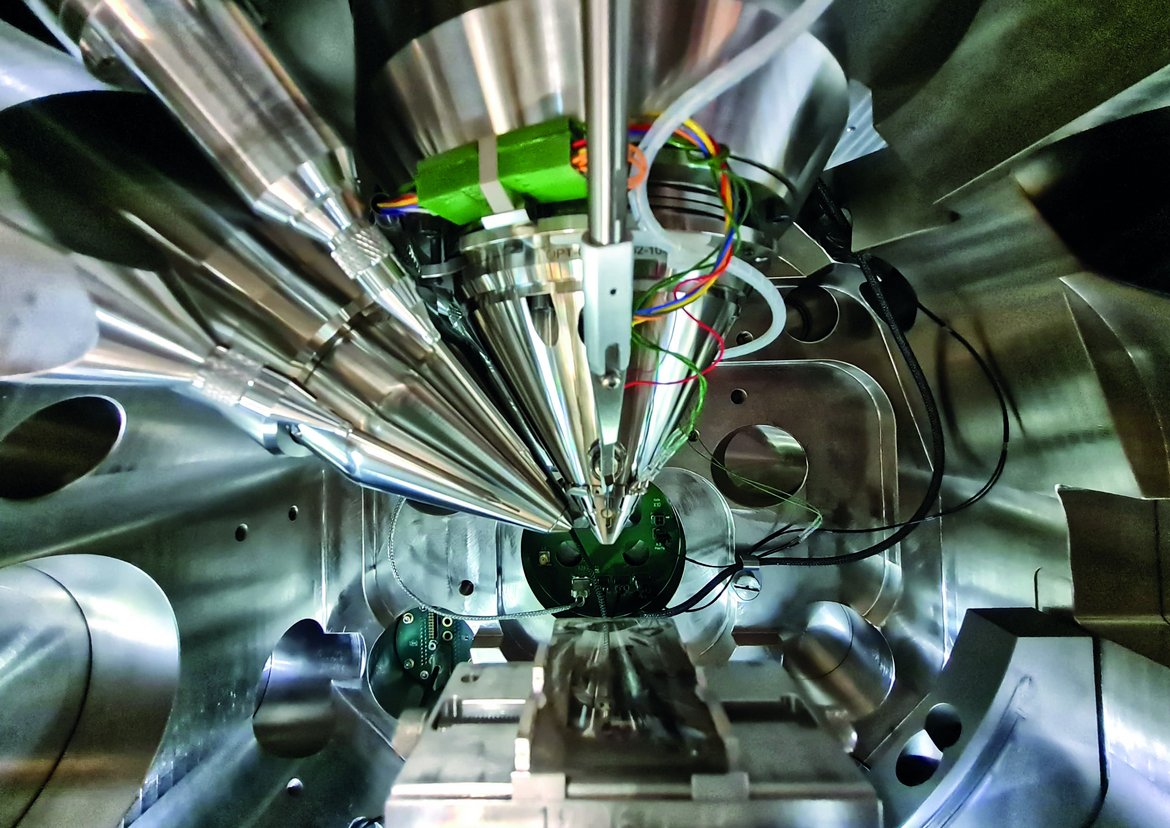
Here, we have a direct view into the sample chamber of our dual-beam electron microscope. This is one of five electron microscopes in the GFZ's PISA (Potsdam Imaging and Spectral Analysis Facility) equipment pool. An electron beam is used to image the sample. Because the wavelength of electrons is much shorter than that of light, these microscopes can be used to image finer details – down to atomic scales of a few hundredths of a nanometre.
We work with the dual-beam electron microscope to investigate, for example, the structure and point chemical composition of rocks and minerals, but also of biological samples. Fossils, foraminifera and meteorites have also been examined. Our measurements support projects at the GFZ as well as those of our national and international partners.
The dual-beam microscope is special because it allows us to prepare the sample in a specific way. The sample is placed on a holder at the bottom of the device. The electron beam, which comes from above, is used to image the sample. The gallium ion beam from the top left can remove material in a targeted manner. This enables the creation of 3D images using layer imaging or the preparation of 0.1 µm thin films at precisely the desired positions – for example, at grain boundaries or mineral inclusions – which are transparent for a transmission electron microscope.
Slime is pretty (and) diverse | Section 3.6 Geomicrobiologie

Several small springs, popular with tourists and locals alike, bubble up next to the Tronto River near Acquasanta in Italy. The name of the tranquil village says it all: “Holyˮ water emerges here, or to be more precise, it is thermal water. This water
contains no dissolved oxygen, but a lot of salt and sulphur compounds. Such conditions create a habitat for a variety of specialised microorganisms, including those that are able to extract energy from sulphur compounds without the need for oxygen. And the surface of the water is teeming with microorganisms that get by with sunlight as their energy source. In the summer of 2024, I took samples of these microorganisms and of the water from the various sources. I want to understand which microorganisms are present in this system and how they affect the precipitating carbonate, e.g. how they influence the microstructure of the carbonate deposits. For example, bubble-like or tree-like branched structures can form. The greenish colouring in this calm spring is due to the chlorophyll of the sunlightconverting bacteria, while the white veil-like structure consists largely of thiovulum, a sulphur oxidiser.
The Türkiye earthquakes from a satellite perspective | 4.1 Dynamic of the Lithosphere
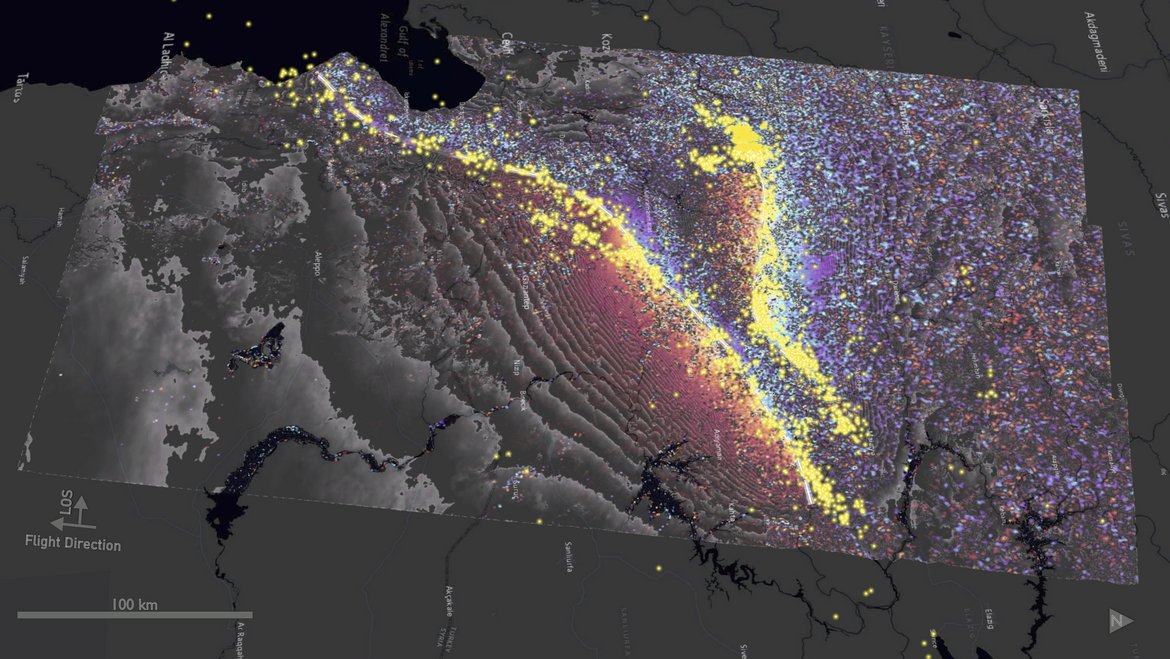
In February 2023, two strong earthquakes with magnitudes of Mw 7.8 and Mw 7.6 shook the border region of Türkiye and Syria. More than 60,000 people were killed and 300,000 buildings were damaged or destroyed. Here, we can see the full extent of the affected area and the ground deformation, as measured by the ESA Sentinel-1 satellite, with North pointing to the right.
When the ground moves due to an earthquake, its distance to the satellite changes. Using radar interferometry (InSAR), we can measure changes in the range of a few millimetres by comparing radar images of the same area, one before and one after an
earthquake. Ground deformations are usually represented as a series of interference strips called “fringesˮ, which are shown in the picture as black-and-white fringes. They represent phase changes in the radar signal, with each strip corresponding to a ground deformation of 2.8 cm in the line-of-sight (LOS) toward or away from the satellite. The movement along the fault is also shown in colour: red tones towards the satellite, blue tones away from it. This movement corresponds to two ruptures of more than 300 km and 100 km in length. For comparison, the yellow dots show the distribution of aftershocks based on data from the Turkish Disaster and Emergency Management Authority AFAD.
Quality starts with tiny drops | Section 4.3 Geoenergy
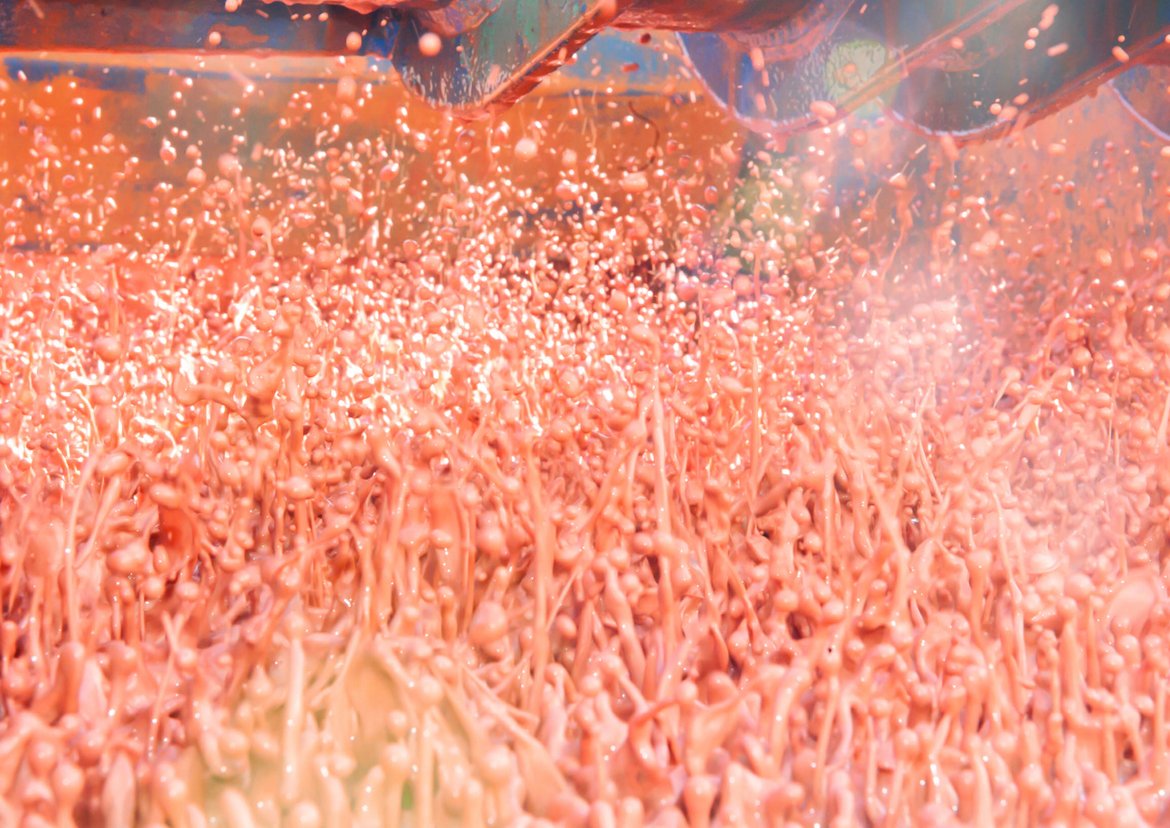
Drops bounce on a vibrating sieve during drilling of the GeoLaB-2 borehole. Each bouncing drop contains a rock particle. These drill cuttings are brought up from the borehole using drilling fluid.
Drilling fluid is crucial for the progress of a borehole. The speed at which any drilling technology can operate is regulated by how quickly the drilling fluid can flush the drill cuttings up from the bottom of the hole. Drilling fluid also supports the borehole and cools the tools and the drill string. It reduces wear, forms a sealing ‘mud cake’ on the borehole wall, transmits measurement signals and reduces friction. And drilling fluid plays a key role in the control of hazards such as blowouts.
Here, we are drilling the ‘GeoLaB’ research tunnel in the Odenwald. It is intended to enable cutting-edge research into ‘deep geothermal energy’. Our goal is the safe and sustainable use of geothermal resources in Germany and worldwide. As part of our research, we are also working on ways to boost drilling speed while minimising wear. This includes the optimisation of the drilling fluid. In doing so, we pay particular attention to the environmental compatibility of the fluid formulation.
Development of the Pakhtakor Glacier | Section 4.4 Hydrology

On this evening in early August 2024, we set up our tents again – on our annual expedition to the glaciers of the Tien Shan Mountains. This time we spent six days travelling – four days on foot and two working days on site. Here in the far east of Uzbekistan, we have also been measuring how the Pakhtakor glacier is developing since last year. This is part of our CAWa-Green and CLIMWATER research projects, which are investigating the water balance in Central Asia in the wake of climate change.
Our tasks on site are varied: we read the values from the automatic weather station, which collects data throughout the year. We measure how the height of the glacier has changed using so-called ablation stakes that are inserted in the ice. We also use GPS data to estimate the height, extent and coordinates of the glacier and the glacier tongue. In the past year, the glacier tongue has shrunk by 20 metres and the ice has lost 3 metres in thickness.
It is also important to observe an upstream glacial lake. Such lakes are critical because if their shoreline structures burst, for example due to overload, catastrophic amounts of water suddenly will flow into the valley, potentially threatening people and infrastructure.
Tracking past climate development in Central Asia | Section 4.6 Geomorphology

On 18 September 2022, I worked on Sary-Chelek Lake in West Kyrgyzstan together with our GFZ-colleague Jens Mingram and our local driver and technician Igor Tutarev. That day we deployed a logger chain to measure the temperature down to 40 m water depth, fixed with a ground weight at more than 150 m. It is part of our activities within the “Focus Site Central Asia”.
Based on sediment cores from different Kyrgyz lakes, we try to reconstruct the climatic development of the region in the past to learn for the future. To better understand the formation of seasonally laminated sediments in these paleoclimate archives, we need current data on the weather and from the lake. With my Alexander von Humboldt Foundation Climate Protection fellowship we aim to develop some new monitoring techniques as well as a webpage providing existing information on Kyrgyz lakes.
Speaking of new monitoring techniques: Always have some chocolate with you —not only as a give-away on various occasions as we usually do. This time, fortunately, we had some on board: the tinfoil from the packaging helped us to repair a broken contact spring of an underwater pressure logger.
CO₂ capture with ground basalt rock | Section 4.6 Geomorphology

Wine connoisseurs will recognise the Pinot Gris here, geologists spot the soil borer (centre), and we see a ‘long-term experiment to save the climate’. The winemaker has been applying ground basalt rock as a mineral fertiliser to his vineyard in the Palatinate region of Germany for 20 years. An unintended side effect: basalt binds the greenhouse gas CO2 by accelerating weathering.
In the mountains, far away from the vines, silicate weathering occurs naturally over geological time scales. It is also known as the ‘Earth's thermostat’, because for millions of years it has kept the temperatures on our planet relatively constant.
So, should we crush rock on a large scale and spread it on fields where it weathers more quickly? The process removes CO2 from the atmosphere, could also counteracts ocean acidification and even fertilises the soil. No additional land is needed for this. But to do this, basalt rock would first have to be mined and crushed. The heavy metals it contains could eventually accumulate in the soil. This is where our research comes in: We, Dirk Sachse and Patrick Frings, are interested in the long-term effects of this basalt fertilisation. According to the winemaker, the wine has already improved in taste.
The carbon cycle in action | Section 4.6 Geomorphology

Seldom do we see the mixing of two rivers as clearly as is visible here at the meeting of the Rio Gazamumo and the Rio Gazaunta in Colombia on the eastern flank of the Andes. For somebody like me, who studies processes on the Earth's surface, this is quite impressive.
Usually, rivers in a specific region are similar to each other. Here, however, one was particularly rich in sediments, probably due to a landslide upstream. While driving by we suddenly saw it: we immediately hit the brakes and set our drone into motion! Right before our eyes was the perfect opportunity to see the carbon cycle in action, so to speak.
With the sediment, organic carbon e.g. from soils and floodplains is also mobilised. A few thousand years can pass before the carbon from this river reaches the Atlantic Ocean some 1600 kilometres away where it is again stored over geological time. In the meantime, it is deposited, eroded or converted by microbial processes over and over again. Whether rivers end up being carbon sources or carbon sinks depends on the balance of such processes. In the ESKOLA project, we are investigating the effects of such natural Earth surface processes as well as anthropogenic factors on matter fluxes in the Colombian Andes. This research project also serves to strengthen our collaboration with Colombian scientists.
A peaceful encounter whilst tephra hunting | Section 4.6 Geomorphology
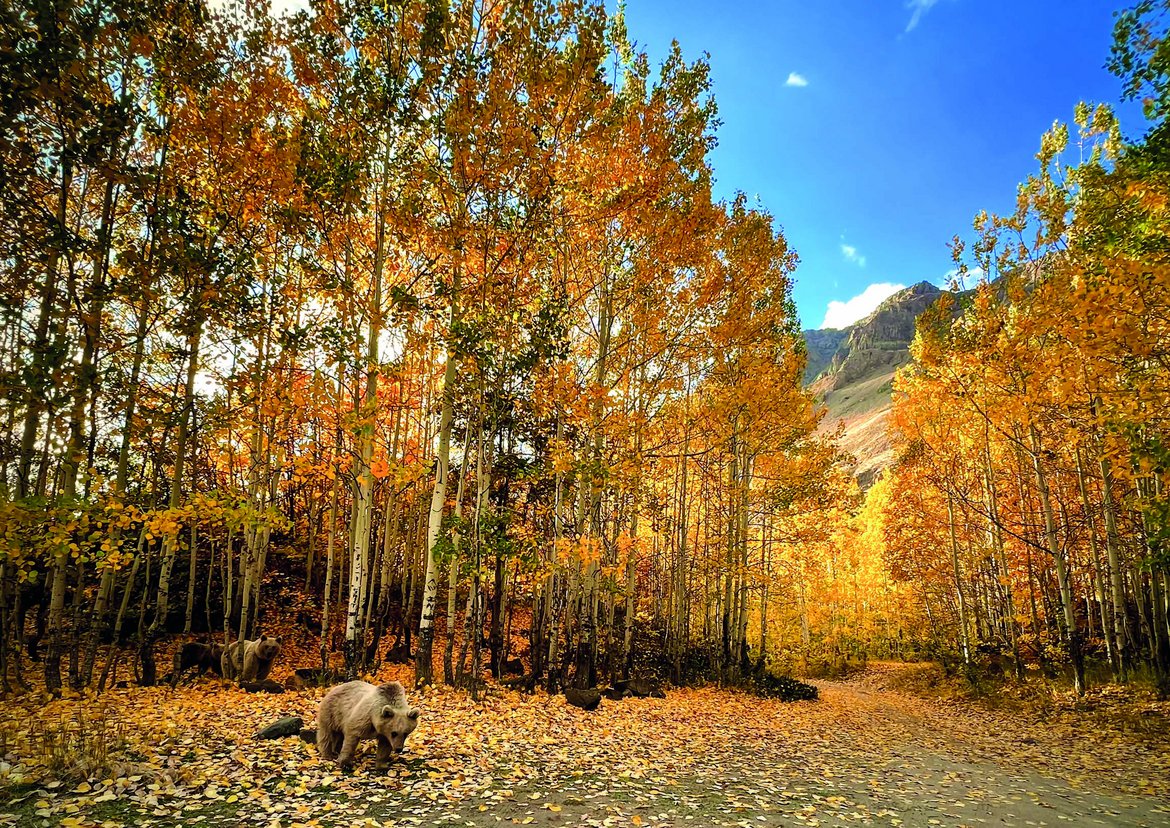
At the Nemrut volcano in eastern Turkey, we encountered this peaceful mother bear with her two cubs at a safe distance.[RK1]
We were looking for samples of volcanic ash and pumice to compare to ash layers found in the lake sediments from Lake Van, Turkey's largest lake. The bears are living in a birch forest in the 8 kilometres wide crater of the dormant Nemrut volcano, which rises to 2948 metres close to the lake. In the background, you can see the remains of the crater wall, which rises up to 700 metres high.
Our main interest is using lake sediments to reconstruct past climate and environments, such as Lake Van. At the GFZ, our laboratory for tephrochronology uses tiny ash particles (20 to 100 micrometres, called cryptotephra) from the sediment to help with dating. In order to determine the cryptotephra’s volcanic origin and age accurately, we also need comparative samples from volcanoes.
[RK1]We decided to remove links to apples as the bears have actually now been removed this year from the crater due to their interaction with tourists. We didnt want to be seen in a bad light if someone decided to google the bears after seeing this
The deep well test site – for our water sampler 2.0 | Section 4.6 Geomorphology

Step by step, we descend 44 metres into the middle of the Telegrafenberg. Here we have set up the prototype of the latest generation of the water sampler developed at the GFZ. The deep well under the glass dome behind the Wirtschaftshof was built back in 1879 to supply water. It was later also used for scientific purposes. At the beginning of the 20th century, for example, gravity measurements carried out there were the first to provide evidence of tidal effects on the Earth's crust.
In March 2023, the well served as a test site for our advanced isotope autosampler. This can work autonomously and independently, but also remotely controlled over many months in the field. The instrument takes strictly separated water samples, filters them and fills them hermetically into sample containers. These samples then undergo isotope analyses in the GFZ laboratories.
The original version of the water sampler from 2016 was only designed to collect rainwater. This latest generation device can also process well and spring water as well as contaminated samples from lakes and rivers. There are currently six, and soon to be ten, such appliances in use worldwide. Meanwhile, we at the GFZ already miss the sporting activity which came with every little thing forgotten at the bottom of the well.
Magnetic Tape Library | Section 5.3 IT Services and Operation

The tape library at the GFZ is part of the server room that was built in the new GeoBioLab in 2021. Each magnetic tape can store between 6 and 12 terabytes of data – and even up to 30 when compressed. They offer the possibility to securely store e.g. little-used data on – compared to HDD hard disks or SSD storage – inexpensive, energy-efficient and particularly durable media.
For example, we save backup data from PCs and servers here. Data from the home directory of users is also stored here after they leave the office. The storage period varies between 60 days and one year, depending on the purpose and agreement. For data from past GFZ projects, it can be 30 years or more.
We also provide an HDD cache area as a fast buffer for not too large amounts of data. Its content is successively written to a free tape after a certain time and is then quasi offline: For reading and writing, the tapes must first be fetched from the magnetic tape library by a robot, inserted into a drive and read from there.
Nature as a Legal Entity | RIFS (Research Institute for Sustainability)

We lived on this boat in the Amazon basin in Brazil for two weeks to conduct field research in the small communities along the Arapiuns River and to shoot a documentary about the Pre-COP30 Youth Climate Conference and the Rights of Nature movement.
The approximately 7,000 km2 Arapiuns river basin is not only the scene of an ecological struggle, but also of many legal innovations. The government had initiated land reform projects to regulate the property rights and self-determination of the communities living there. In the ‘PAE Lago Grande’ agroforestry project, 35,000 people are trying to legally enshrine their traditional ways of life and sustainable land use practices. In doing so, they are fighting back against environmental destruction, land grabbing and large mining projects.
Inspired by global indigenous movements, the communities are demanding legal status for rivers and forests in the Amazon, as they regard nature as a living being. The Amazon is thus seen not only as a crisis area, but as a place of hope, knowledge and opportunity.